


The maps that help you understand Wales
Cymru has a lot of issues, but they can be hard to understand

Wales has a whole host of issues that are really complicated problems.
However they get very little attention. Due to their complexity many people don’t understand these issues which in turn makes it very hard to hold elected representative to account for their shortcomings.
Take poverty. It is tricky to settle on an exact figure because it all depends on how and when you are measuring it. On top of this you have the pandemic which skewed the data.
But we can do some ball park figures:
- There are about 600k children live in Wales
- Of those, just under one in three, or 200k, are in poverty. This is households at or below 60% of median income.
- Of those, 90k are living in severe poverty (below 50% of median income).
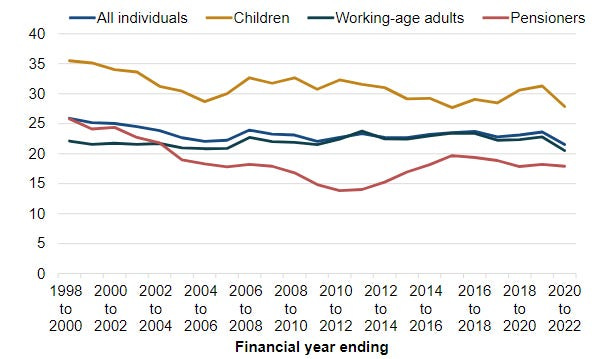
The horrible facts of the matter that there is a higher percentage of children in poverty than any other age groups:
This brings us to our first map which may suggest that poverty is a Valleys problem (the dark bits to the north of Cardiff in the SE).
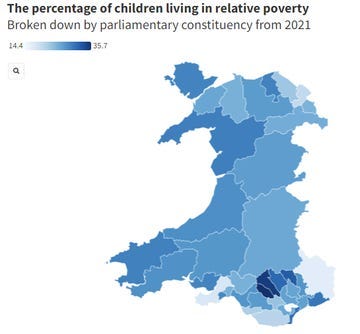
Now of course there are challenges in the Valleys. However if you work on this assumption you massively miss the wider issue.
To understand we need to look closer.
This map shows all 1,909 LSOAs (400 to 1,200 households) in Wales ranked based on income.
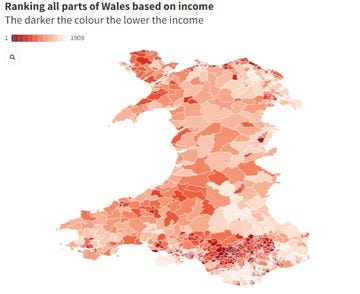
These maps show Cardiff and the Valleys respectively.


Clearly there are there are pockets of the Valleys which have decent incomes. In turn there are parts of the Welsh capital that are incredibly deprived.
You may be surprised to hear that the poorest part and the richest part of Wales are right next to each other! Head into the city centre and stroll along Fitzhamon Embankment. As you look east across the River Taff you can see over a billion pounds of investment (the Principality stadium, BBC building, site of the former Brains brewery etc). But immediately behind you is the south Riverside area. Here more than half of the kids live in poverty.
What I am trying to demonstrate is that poverty is complex, multifaceted and entrenched.
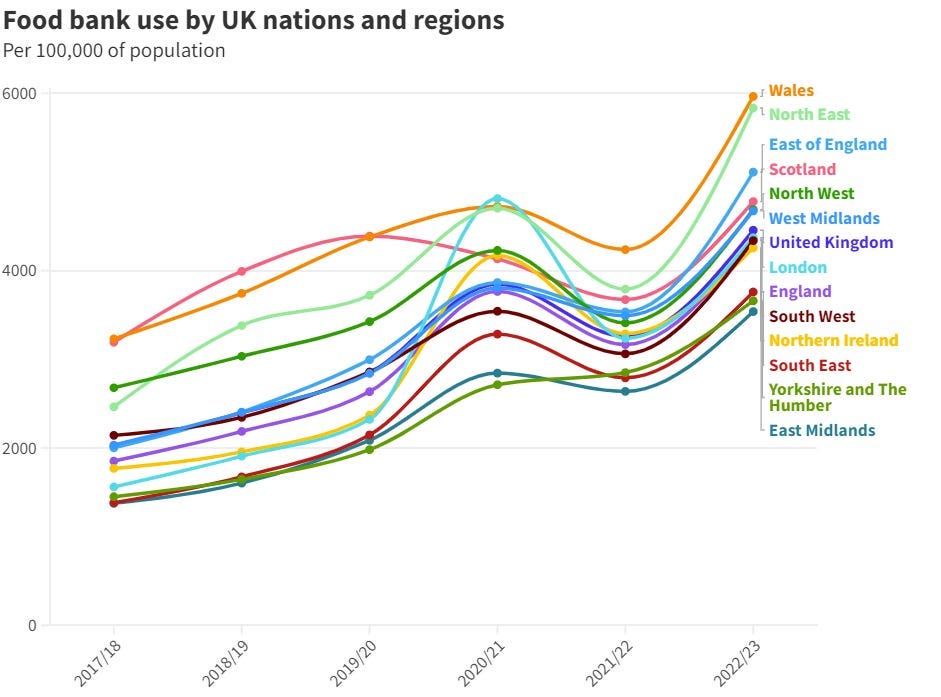
Now don’t get me wrong, Wales isn't unique in having a poverty issue. However it does have a bigger poverty problem than other parts of the UK. This graph shows food bank use in Wales:
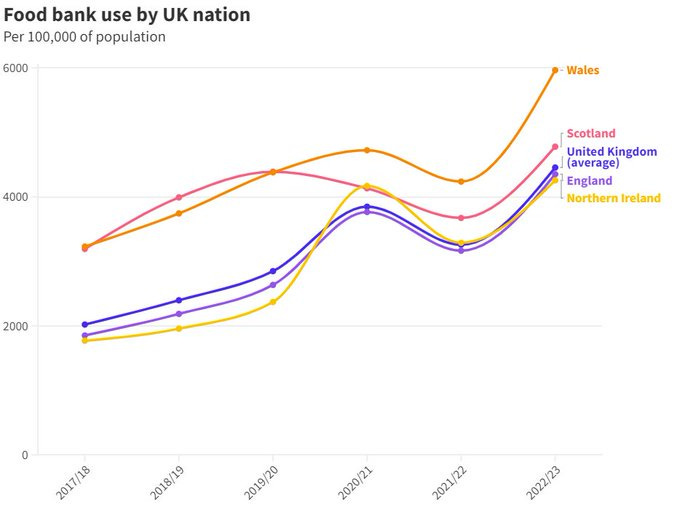
This map is pretty damning of the Welsh Government. As they always do they will argue that it isn’t fair to compare Wales with England give that England is so much bigger and has large pockets of wealth. This would be a strong point except when we compare Wales to regions of England where Wales is still highest in terms of food bank use.
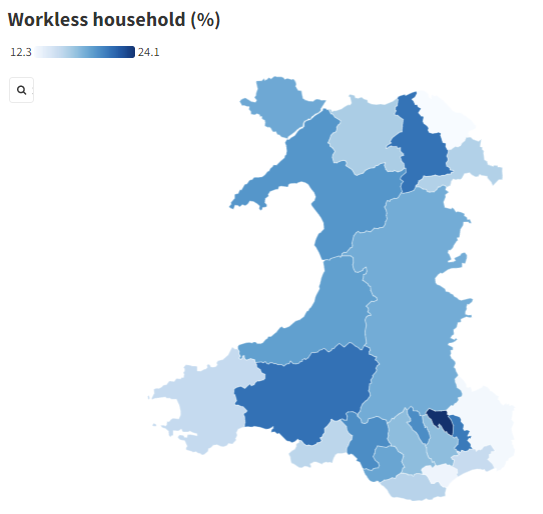
More insights come when we look at the jobs in Wales. The map below shows the percentage of households in an area which have no-one in employment.
The darkest area is Blaenau Gwent where almost a quarter of households have no-one working.
Obviously large scale unemployment doesn't help poverty but this issue is deeper thank unemployment. The Joseph Rowntree Foundation figures show the majority of people who are in poverty are also in employment.
It is often the cast that the quality and pay of the jobs for people that are in that are the issue.
So how can we get Wales out of the poverty spiral? Better education and transport perhaps...
When it comes to education things are also not good, as the recent Pisa results showed. Though there are reasons to take those scores with a pinch of salt they are indicative of changes in performance.
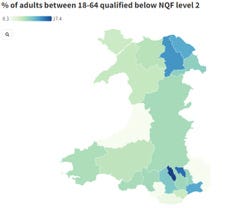
The map below shows the amount of people who don't have any qualifications of NQF level 2 (GCSE) or above. In Merthyr for example (which is the dark area in south), close to one in five don't have that level of qualification. Tackling poverty when there are very low levels of education is extremely tricky.
Old and ill
It isn’t just poverty that you need to understand to get a proper grounding in Wales’ issues. Age and health are important as well (an obviously intrinsically linked to poverty).
Take a look at the 2 maps below.
The blue one shows the amount of people over 65 (the darker it is, the higher the % of older people). The green one shows population density (the lighter the colour the more spread out the people.


This tells us several things:
Cymru is FAR less densely populated than England.
Wales’ population is significantly older than England (not least because so many people retire here).
The areas of Wales that are the oldest are the least densely populated
Clearly, older people are more likely to need public services like health and social care. But in Wales, the people that fall into this category are very spread out.
This means it is more expensive to provide care and support for the same number of old people in Wales as it would be in England.
This massively contributes to the pressure on Wales' public services.
Language, identity and LOTS of second homes
Second homes are a huge issue in some parts of Wales.
The sheer volume of second homes means that local people are priced out and unable to buy in their local area. This then reduces numbers in schools, which leads to closures which in turn forces more local people to move out.
It is a vicious cycle.
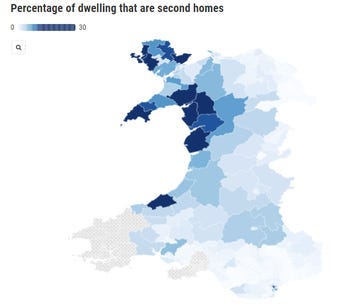
This map shows the breakdown of second homes by local authority.
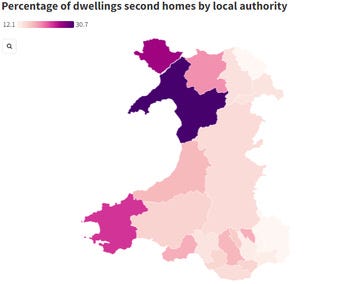
As you can see, in places like Gwynedd an astonishing 30% of dwellings are second/holiday homes. This is followed by Pembrokeshire and Ynys Mon.
If we break the data down to a more local level in the next map you can see where the concentrations are. Frustratingly there is no data at this level for Swansea and Pembs.
However, beyond the impacts on services, the second homes surge has been devastating for the Welsh language.
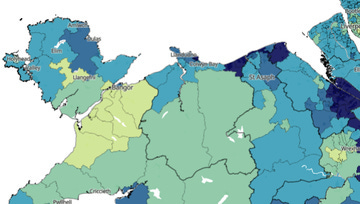
The map below shows what percentage of people in an area that speak Welsh.
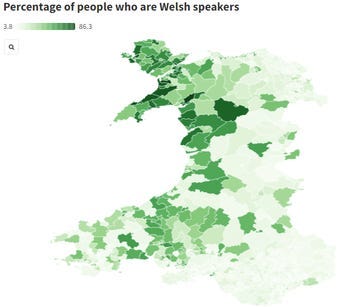
It is almost like for like with the map showing where the most second homes are. These areas have been the engine room and safeguard to Cymraeg for centuries but are now under real threat.
National identity in Wales is a peculiar.
Research by Cardiff academic Professor Richard Wyn Jones found that the younger you are the more likely you are to identify as Welsh rather than British, whereas older people are more likely to identify themselves as British and Welsh.
This impacts on politics, outlook and often voting intention.
This map shows the percentage of people who identify only as Welsh (darker colours mean higher numbers)
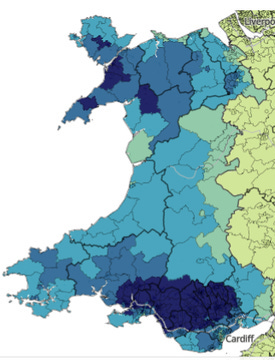
Interestingly, people identifying as both Welsh and British are far more likely to live in areas in south Wales around the capital.
You can see that on this map:
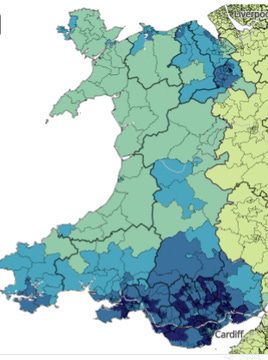
If you instead just look at people who identify as only English you can see how interconnected parts of north Wales are especially with Merseyside.
I appreciate that this was a bit of a map and graph binge. But I think it is really hard to understand Wales and its challenges without understanding the demographics that underpin them.
I have retired now, but 10 years ago I spent 4 months working in Caernarfon and then Wrexham. Caernarfon is very Welsh, but although Welsh speaking I was able to read the Welsh language for the work I was doing by way of Google translates. Also the people in town had dual language. Wrexham is much closer to Cheshire and the Wirral. So people speak English but many can speak Welsh. It's within commuting distance of major English conurbations. The rest of Wales for me is out of sight and out of mind. I was last in Cardiff and South Wales in 2003. Now that's true of many parts of England for me, but because England has a bigger overall population in most cases these regions don't need people like me to thrive. Wales perhaps does - but not by buying a second home!